Calculates common social network measures on each selected input network.
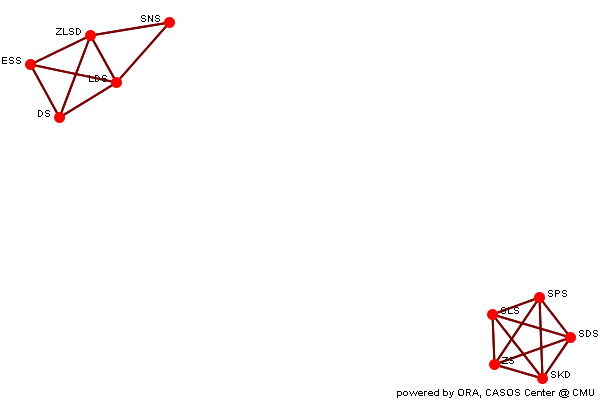
Analysis for the Meta-Network
Individual entity classes have been combined into a single class, and all networks are combined to create a single network. If two networks connect the same entities, e.g. two agent x agent, then the links are combined. Link weights are made binary.
Row count 10 Column count 10 Link count 36 Density 0.4 Isolate count 0 Component count 2 Reciprocity 1 Characteristic path length 1.1 Clustering coefficient 0.9333 Network levels (diameter) 2 Network fragmentation 0.5556 Krackhardt connectedness 0.4444 Krackhardt efficiency 0.1667 Krackhardt hierarchy 0 Krackhardt upperboundedness 1 Degree centralization 0.05556 Betweenness centralization 0.02469 Closeness centralization 0.002836
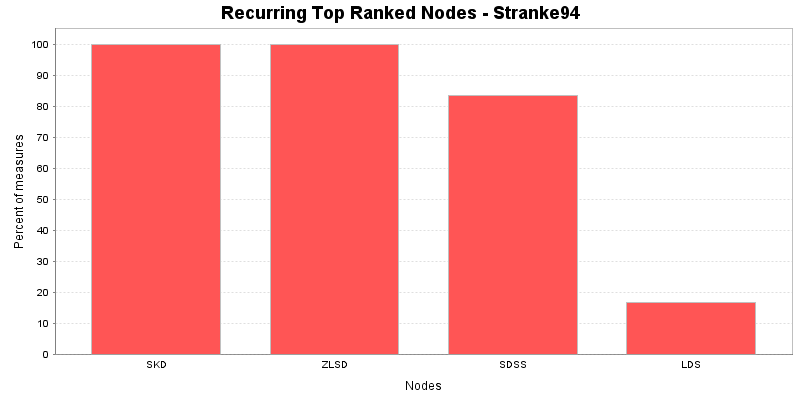
Min Max Average Stddev Total degree centrality 0.2222 0.4444 0.4 0.0737 Total degree centrality (unscaled) 4 8 7.2 1.327 Eigenvector centrality 0.6018 1 0.9323 0.1231 Hub centrality 0.6018 1 0.9323 0.1231 Authority centrality 0.6018 1 0.9323 0.1231 Betweenness centrality 0 0.02778 0.005556 0.01111 Betweenness centrality (unscaled) 0 2 0.4 0.8 Information centrality 0.1 0.1 0.1 6.706e-009 Information centrality (unscaled) -3.385e-007 -3.385e-007 -3.385e-007 2.558e-014 Clique membership count 1 2 1.2 0.4 Simmelian ties 0.2222 0.4444 0.4 0.0737 Simmelian ties (unscaled) 2 4 3.6 0.6633 Clustering coefficient 0.6667 1 0.9333 0.1333 Key nodes
This chart shows the Nodes that repeatedly rank in the top three in the measures. The value shown is the percentage of measures for which the Nodes was ranked in the top three.
In-degree centrality
The In Degree Centrality of a node is its normalized in-degree.
Input network(s): meta-network
Rank Value Unscaled Nodes 1 0.444444 4 SKD 2 0.444444 4 ZLSD 3 0.444444 4 SDSS 4 0.444444 4 LDS 5 0.444444 4 ZS 6 0.444444 4 SLS 7 0.444444 4 SPS 8 0.333333 3 ZS-ESS 9 0.333333 3 DS 10 0.222222 2 SNS Out-degree centrality
The Out Degree Centrality of a node is its normalized out-degree.
Input network(s): meta-network
Rank Value Unscaled Nodes 1 0.444444 4 SKD 2 0.444444 4 ZLSD 3 0.444444 4 SDSS 4 0.444444 4 LDS 5 0.444444 4 ZS 6 0.444444 4 SLS 7 0.444444 4 SPS 8 0.333333 3 ZS-ESS 9 0.333333 3 DS 10 0.222222 2 SNS Total degree centrality
The Total Degree Centrality of a node is the normalized sum of its row and column degrees.
Input network(s): meta-network
Input network size: 10
Input network density: 0.4
Expected value from a random network of the same size and density: 0.4
Rank Value Unscaled Nodes Context* 1 0.444444 8 SKD 0.286888 2 0.444444 8 ZLSD 0.286888 3 0.444444 8 SDSS 0.286888 4 0.444444 8 LDS 0.286888 5 0.444444 8 ZS 0.286888 6 0.444444 8 SLS 0.286888 7 0.444444 8 SPS 0.286888 8 0.333333 6 ZS-ESS -0.430331 9 0.333333 6 DS -0.430331 10 0.222222 4 SNS -1.14755 * Number of standard deviations from the mean if links were distributed randomly Mean: 0.4 Std.dev: 0.154919 Eigenvector centrality
Calculates the principal eigenvector of the network. A node is central to the extent that its neighbors are central.
Input network(s): meta-network
Input network size: 10
Input network density: 0.4
Expected value from a random network of the same size and density: 0.588922
Rank Value Nodes Context* 1 1 SKD 1.59642 2 1 ZLSD 1.59642 3 1 SDSS 1.59642 4 1 LDS 1.59642 5 1 ZS 1.59642 6 1 SPS 1.59642 7 1 SLS 1.59642 8 0.860806 ZS-ESS 1.05586 9 0.860806 DS 1.05586 10 0.601793 SNS 0.0499813 * Number of standard deviations from the mean if links were distributed randomly Mean: 0.588922 Std.dev: 0.2575 Betweenness centrality
The Betweenness Centrality of node v in a network is defined as: across all node pairs that have a shortest path containing v, the percentage that pass through v.
Input network(s): meta-network
Input network size: 10
Input network density: 0.4
Expected value from a random network of the same size and density: 0.0887111
Rank Value Unscaled Nodes Context* 1 0.0277778 2 ZLSD -0.987331 2 0.0277778 2 LDS -0.987331 * Number of standard deviations from the mean if links were distributed randomly Mean: 0.0887111 Std.dev: 0.0617152 Closeness centrality
The average closeness of a node to the other nodes in a network. Loosely, Closeness is the inverse of the average distance in the network between the node and all other nodes.
Input network(s): meta-network
Input network size: 10
Input network density: 0.4
Expected value from a random network of the same size and density: 0.627451
Rank Value Unscaled Nodes Context* 1 0.166667 0.0185185 SKD -4.52505 2 0.166667 0.0185185 ZLSD -4.52505 3 0.166667 0.0185185 SDSS -4.52505 4 0.166667 0.0185185 LDS -4.52505 5 0.166667 0.0185185 ZS -4.52505 6 0.166667 0.0185185 SLS -4.52505 7 0.166667 0.0185185 SPS -4.52505 8 0.163636 0.0181818 ZS-ESS -4.5548 9 0.163636 0.0181818 DS -4.5548 10 0.160714 0.0178571 SNS -4.5835 * Number of standard deviations from the mean if links were distributed randomly Mean: 0.627451 Std.dev: 0.10183