Calculates common social network measures on each selected input network.
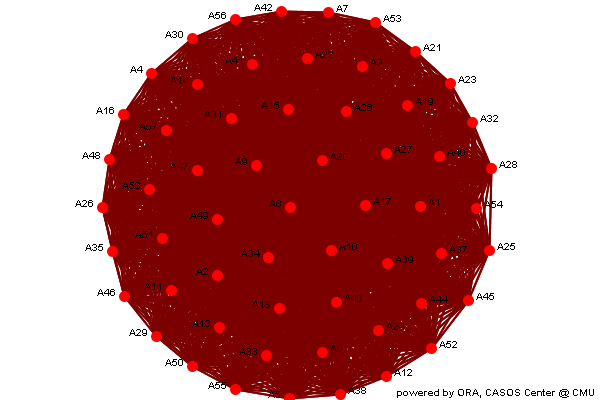
Analysis for the Meta-Network
Individual entity classes have been combined into a single class, and all networks are combined to create a single network. If two networks connect the same entities, e.g. two agent x agent, then the links are combined. Link weights are made binary.
Row count 58 Column count 58 Link count 3306 Density 1 Isolate count 0 Component count 1 Reciprocity 1 Characteristic path length 1 Clustering coefficient 1 Network levels (diameter) 1 Network fragmentation 0 Krackhardt connectedness 1 Krackhardt efficiency 0 Krackhardt hierarchy 0 Krackhardt upperboundedness 1 Degree centralization 0 Betweenness centralization 0 Closeness centralization 0
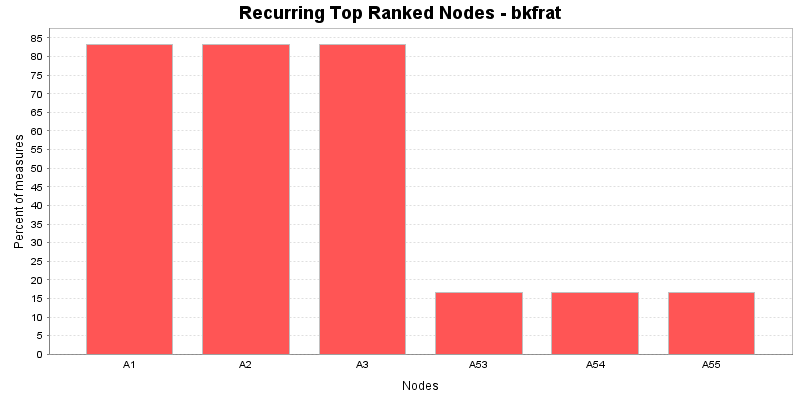
Min Max Average Stddev Total degree centrality 1 1 1 0 Total degree centrality (unscaled) 114 114 114 0 Eigenvector centrality 1 1 1 1.104e-007 Hub centrality 1 1 1 1.191e-007 Authority centrality 1 1 1 1.191e-007 Betweenness centrality 0 0 0 0 Betweenness centrality (unscaled) 0 0 0 0 Information centrality 0.01724 0.01724 0.01724 0 Information centrality (unscaled) 29.51 29.51 29.51 0 Clique membership count 1 1 1 0 Simmelian ties 1 1 1 0 Simmelian ties (unscaled) 57 57 57 0 Clustering coefficient 1 1 1 0 Key nodes
This chart shows the Nodes that repeatedly rank in the top three in the measures. The value shown is the percentage of measures for which the Nodes was ranked in the top three.
In-degree centrality
The In Degree Centrality of a node is its normalized in-degree.
Input network(s): meta-network
Rank Value Unscaled Nodes 1 1 57 All nodes have this value Out-degree centrality
The Out Degree Centrality of a node is its normalized out-degree.
Input network(s): meta-network
Rank Value Unscaled Nodes 1 1 57 All nodes have this value Total degree centrality
The Total Degree Centrality of a node is the normalized sum of its row and column degrees.
Input network(s): meta-network
Input network size: 58
Input network density: 1
Expected value from a random network of the same size and density: 1
Rank Value Unscaled Nodes Context* 1 1 114 All nodes have this value * Number of standard deviations from the mean if links were distributed randomly Mean: 1 Std.dev: 0 Eigenvector centrality
Calculates the principal eigenvector of the network. A node is central to the extent that its neighbors are central.
Input network(s): meta-network
Input network size: 58
Input network density: 1
Expected value from a random network of the same size and density: 0.989737
Rank Value Nodes Context* 1 1 All nodes have this value * Number of standard deviations from the mean if links were distributed randomly Mean: 0.989737 Std.dev: 0.294662 Betweenness centrality
The Betweenness Centrality of node v in a network is defined as: across all node pairs that have a shortest path containing v, the percentage that pass through v.
Input network(s): meta-network
Input network size: 58
Input network density: 1
Expected value from a random network of the same size and density: -0.0041468
Rank Value Unscaled Nodes Context* 1 0 0 All nodes have this value * Number of standard deviations from the mean if links were distributed randomly Mean: -0.0041468 Std.dev: -0.0105537 Closeness centrality
The average closeness of a node to the other nodes in a network. Loosely, Closeness is the inverse of the average distance in the network between the node and all other nodes.
Input network(s): meta-network
Input network size: 58
Input network density: 1
Expected value from a random network of the same size and density: 0.862745
Rank Value Unscaled Nodes Context* 1 1 0.0175439 All nodes have this value * Number of standard deviations from the mean if links were distributed randomly Mean: 0.862745 Std.dev: 0.0397073