Calculates common social network measures on each selected input network.
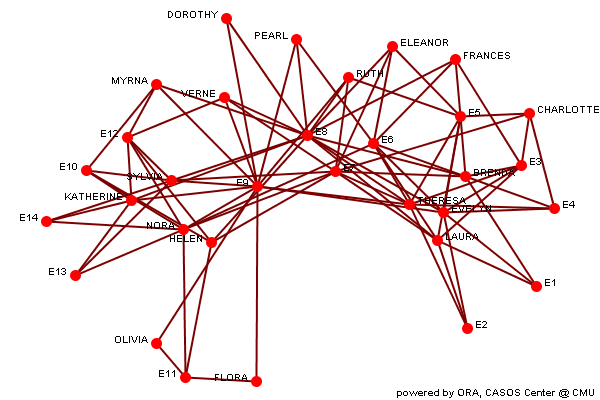
Analysis for the Meta-Network
Individual entity classes have been combined into a single class, and all networks are combined to create a single network. If two networks connect the same entities, e.g. two agent x agent, then the links are combined. Link weights are made binary.
Row count 32 Column count 32 Link count 89 Density 0.08972 Isolate count 0 Component count 1 Reciprocity 0 Characteristic path length 1 Clustering coefficient 0 Network levels (diameter) 1 Network fragmentation 0 Krackhardt connectedness 1 Krackhardt efficiency 0.8753 Krackhardt hierarchy 1 Krackhardt upperboundedness 0.2667 Degree centralization 0.1452 Betweenness centralization 0 Closeness centralization 0.01486
Min Max Average Stddev Total degree centrality 0.03226 0.2258 0.08972 0.04596 Total degree centrality (unscaled) 2 14 5.563 2.85 Eigenvector centrality 0.1373 1 0.4513 0.1997 Hub centrality 0 1 0.3362 0.3384 Authority centrality 0 1 0.2053 0.2821 Betweenness centrality 0 0 0 0 Betweenness centrality (unscaled) 0 0 0 0 Information centrality 0 0.07442 0.03125 0.02958 Information centrality (unscaled) 0 3.945 1.657 1.568 Clique membership count 0 0 0 0 Simmelian ties 0 0 0 0 Simmelian ties (unscaled) 0 0 0 0 Clustering coefficient 0 0 0 0 Key nodes
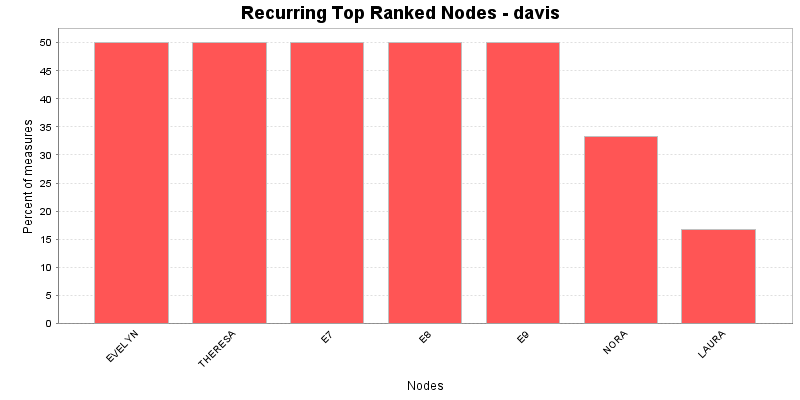
This chart shows the Nodes that repeatedly rank in the top three in the measures. The value shown is the percentage of measures for which the Nodes was ranked in the top three.
In-degree centrality
The In Degree Centrality of a node is its normalized in-degree.
Input network(s): meta-network
Rank Value Unscaled Nodes 1 0.451613 14 E8 2 0.387097 12 E9 3 0.322581 10 E7 4 0.258065 8 E5 5 0.258065 8 E6 6 0.193548 6 E3 7 0.193548 6 E12 8 0.16129 5 E10 9 0.129032 4 E4 10 0.129032 4 E11 Out-degree centrality
The Out Degree Centrality of a node is its normalized out-degree.
Input network(s): meta-network
Rank Value Unscaled Nodes 1 0.258065 8 EVELYN 2 0.258065 8 THERESA 3 0.258065 8 NORA 4 0.225806 7 LAURA 5 0.225806 7 BRENDA 6 0.225806 7 SYLVIA 7 0.193548 6 KATHERINE 8 0.16129 5 HELEN 9 0.129032 4 CHARLOTTE 10 0.129032 4 FRANCES Total degree centrality
The Total Degree Centrality of a node is the normalized sum of its row and column degrees.
Input network(s): meta-network
Input network size: 32
Input network density: 0.0897177
Expected value from a random network of the same size and density: 0.0897177
Rank Value Unscaled Nodes Context* 1 0.225806 14 E8 2.69383 2 0.193548 12 E9 2.05529 3 0.16129 10 E7 1.41675 4 0.129032 8 EVELYN 0.778217 5 0.129032 8 THERESA 0.778217 6 0.129032 8 NORA 0.778217 7 0.129032 8 E5 0.778217 8 0.129032 8 E6 0.778217 9 0.112903 7 LAURA 0.458948 10 0.112903 7 BRENDA 0.458948 * Number of standard deviations from the mean if links were distributed randomly Mean: 0.0897177 Std.dev: 0.0505187 Eigenvector centrality
Calculates the principal eigenvector of the network. A node is central to the extent that its neighbors are central.
Input network(s): meta-network
Input network size: 32
Input network density: 0.0897177
Expected value from a random network of the same size and density: 0.390478
Rank Value Nodes Context* 1 1 E8 2.16265 2 0.756965 E7 1.30033 3 0.749049 E9 1.27225 4 0.731425 THERESA 1.20972 5 0.660704 EVELYN 0.95879 6 0.646661 E6 0.908964 7 0.635043 E5 0.867745 8 0.617822 BRENDA 0.806642 9 0.610353 LAURA 0.780142 10 0.547092 SYLVIA 0.555684 * Number of standard deviations from the mean if links were distributed randomly Mean: 0.390478 Std.dev: 0.28184 Betweenness centrality
The Betweenness Centrality of node v in a network is defined as: across all node pairs that have a shortest path containing v, the percentage that pass through v.
Input network(s): meta-network
Input network size: 32
Input network density: 0.0897177
Expected value from a random network of the same size and density: 0.0623155
Rank Value Unscaled Nodes Context* 1 0 0 All nodes have this value * Number of standard deviations from the mean if links were distributed randomly Mean: 0.0623155 Std.dev: 0.0941021 Closeness centrality
The average closeness of a node to the other nodes in a network. Loosely, Closeness is the inverse of the average distance in the network between the node and all other nodes.
Input network(s): meta-network
Input network size: 32
Input network density: 0.0897177
Expected value from a random network of the same size and density: 0.28854
Rank Value Unscaled Nodes Context* 1 0.0416667 0.00134409 EVELYN -4.27322 2 0.0416667 0.00134409 THERESA -4.27322 3 0.0416667 0.00134409 NORA -4.27322 4 0.04 0.00129032 LAURA -4.30207 5 0.04 0.00129032 BRENDA -4.30207 6 0.04 0.00129032 SYLVIA -4.30207 7 0.0384615 0.00124069 KATHERINE -4.3287 8 0.037037 0.00119474 HELEN -4.35335 9 0.0357143 0.00115207 CHARLOTTE -4.37625 10 0.0357143 0.00115207 FRANCES -4.37625 * Number of standard deviations from the mean if links were distributed randomly Mean: 0.28854 Std.dev: 0.0577722