Calculates common social network measures on each selected input network.
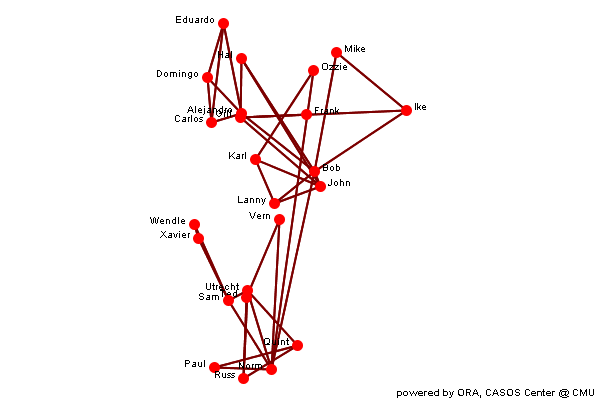
Analysis for the Meta-Network
Individual entity classes have been combined into a single class, and all networks are combined to create a single network. If two networks connect the same entities, e.g. two agent x agent, then the links are combined. Link weights are made binary.
Row count 24 Column count 24 Link count 76 Density 0.1377 Isolate count 0 Component count 1 Reciprocity 1 Characteristic path length 2.993 Clustering coefficient 0.4421 Network levels (diameter) 6 Network fragmentation 0 Krackhardt connectedness 1 Krackhardt efficiency 0.9407 Krackhardt hierarchy 0 Krackhardt upperboundedness 1 Degree centralization 0.1818 Betweenness centralization 0.5475 Closeness centralization 0.3538
Min Max Average Stddev Total degree centrality 0.04348 0.3043 0.1377 0.05842 Total degree centrality (unscaled) 2 14 6.333 2.687 Eigenvector centrality 0.07726 1 0.3491 0.2343 Hub centrality 0.07726 1 0.3491 0.2343 Authority centrality 0.07726 1 0.3491 0.2343 Betweenness centrality 0 0.6153 0.09058 0.1626 Betweenness centrality (unscaled) 0 311.3 45.83 82.26 Information centrality 0.02838 0.06026 0.04167 0.008555 Information centrality (unscaled) 0.4225 0.8971 0.6203 0.1274 Clique membership count 0 4 1.167 0.9428 Simmelian ties 0 0.2174 0.09783 0.06307 Simmelian ties (unscaled) 0 5 2.25 1.451 Clustering coefficient 0 1 0.4421 0.3724 Key nodes
This chart shows the Nodes that repeatedly rank in the top three in the measures. The value shown is the percentage of measures for which the Nodes was ranked in the top three.
In-degree centrality
The In Degree Centrality of a node is its normalized in-degree.
Input network(s): meta-network
Rank Value Unscaled Nodes 1 0.304348 7 Bob 2 0.26087 6 Norm 3 0.217391 5 John 4 0.173913 4 Gill 5 0.173913 4 Alejandro 6 0.173913 4 Utrecht 7 0.173913 4 Sam 8 0.130435 3 Ike 9 0.130435 3 Hal 10 0.130435 3 Karl Out-degree centrality
The Out Degree Centrality of a node is its normalized out-degree.
Input network(s): meta-network
Rank Value Unscaled Nodes 1 0.304348 7 Bob 2 0.26087 6 Norm 3 0.217391 5 John 4 0.173913 4 Gill 5 0.173913 4 Alejandro 6 0.173913 4 Utrecht 7 0.173913 4 Sam 8 0.130435 3 Ike 9 0.130435 3 Hal 10 0.130435 3 Karl Total degree centrality
The Total Degree Centrality of a node is the normalized sum of its row and column degrees.
Input network(s): meta-network
Input network size: 24
Input network density: 0.137681
Expected value from a random network of the same size and density: 0.137681
Rank Value Unscaled Nodes Context* 1 0.304348 14 Bob 2.36964 2 0.26087 12 Norm 1.75148 3 0.217391 10 John 1.13331 4 0.173913 8 Gill 0.51514 5 0.173913 8 Alejandro 0.51514 6 0.173913 8 Utrecht 0.51514 7 0.173913 8 Sam 0.51514 8 0.130435 6 Ike -0.103028 9 0.130435 6 Hal -0.103028 10 0.130435 6 Karl -0.103028 * Number of standard deviations from the mean if links were distributed randomly Mean: 0.137681 Std.dev: 0.070334 Eigenvector centrality
Calculates the principal eigenvector of the network. A node is central to the extent that its neighbors are central.
Input network(s): meta-network
Input network size: 24
Input network density: 0.137681
Expected value from a random network of the same size and density: 0.424808
Rank Value Nodes Context* 1 1 Bob 1.95512 2 0.809597 John 1.30793 3 0.604091 Hal 0.609397 4 0.577069 Lanny 0.517548 5 0.557289 Norm 0.450314 6 0.528368 Gill 0.35201 7 0.494693 Ike 0.237545 8 0.44128 Alejandro 0.055992 9 0.42379 Karl -0.00345981 10 0.386204 Mike -0.131218 * Number of standard deviations from the mean if links were distributed randomly Mean: 0.424808 Std.dev: 0.294198 Betweenness centrality
The Betweenness Centrality of node v in a network is defined as: across all node pairs that have a shortest path containing v, the percentage that pass through v.
Input network(s): meta-network
Input network size: 24
Input network density: 0.137681
Expected value from a random network of the same size and density: 0.0725006
Rank Value Unscaled Nodes Context* 1 0.615283 311.333 Bob 10.705 2 0.571805 289.333 Norm 9.84747 3 0.237154 120 Alejandro 3.24736 4 0.166008 84 Sam 1.84419 5 0.119895 60.6667 Utrecht 0.934722 6 0.0922266 46.6667 Gill 0.389044 7 0.085639 43.3333 John 0.25912 8 0.0671937 34 Vern -0.104665 9 0.0474308 24 Ike -0.494435 10 0.0395257 20 Hal -0.650343 * Number of standard deviations from the mean if links were distributed randomly Mean: 0.0725006 Std.dev: 0.0507038 Closeness centrality
The average closeness of a node to the other nodes in a network. Loosely, Closeness is the inverse of the average distance in the network between the node and all other nodes.
Input network(s): meta-network
Input network size: 24
Input network density: 0.137681
Expected value from a random network of the same size and density: 0.352996
Rank Value Unscaled Nodes Context* 1 0.511111 0.0222222 Bob 2.54704 2 0.5 0.0217391 Norm 2.36805 3 0.396552 0.0172414 John 0.701622 4 0.383333 0.0166667 Utrecht 0.48869 5 0.377049 0.0163934 Hal 0.38746 6 0.377049 0.0163934 Lanny 0.38746 7 0.377049 0.0163934 Alejandro 0.38746 8 0.377049 0.0163934 Sam 0.38746 9 0.370968 0.016129 Ike 0.289495 10 0.370968 0.016129 Ozzie 0.289495 * Number of standard deviations from the mean if links were distributed randomly Mean: 0.352996 Std.dev: 0.0620779