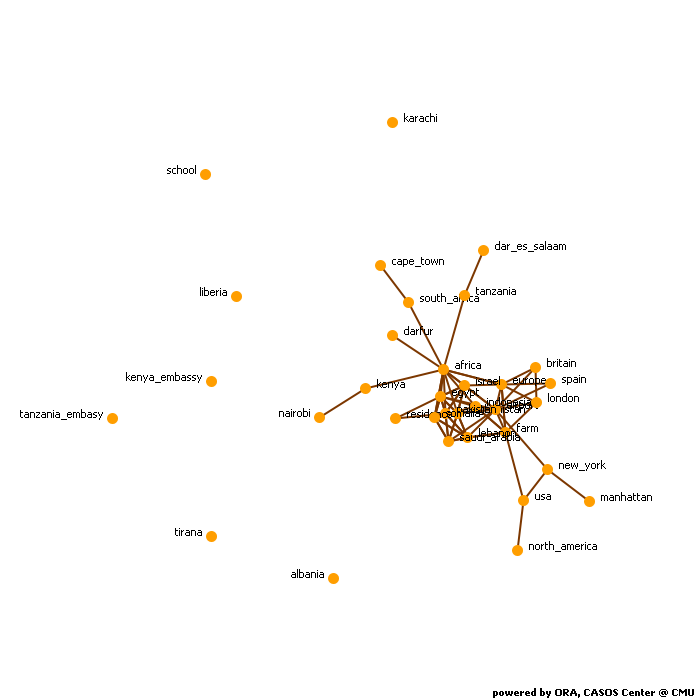
Network Level Measures
Measure Value Row count 34.000 Column count 34.000 Link count 83.000 Density 0.072 Components of 1 node (isolates) 7 Components of 2 nodes (dyadic isolates) 0 Components of 3 or more nodes 1 Reciprocity 0.344 Characteristic path length 3.689 Clustering coefficient 0.200 Network levels (diameter) 12.000 Network fragmentation 0.374 Krackhardt connectedness 0.626 Krackhardt efficiency 0.889 Krackhardt hierarchy 0.572 Krackhardt upperboundedness 1.000 Degree centralization 0.067 Betweenness centralization 0.190 Closeness centralization 0.022 Eigenvector centralization 0.469 Reciprocal (symmetric)? No (34% of the links are reciprocal)
Node Level Measures
Measure Min Max Avg Stddev Total degree centrality 0.000 0.086 0.023 0.025 Total degree centrality [Unscaled] 0.000 23.000 6.118 6.777 In-degree centrality 0.000 0.125 0.023 0.030 In-degree centrality [Unscaled] 0.000 17.000 3.118 4.028 Out-degree centrality 0.000 0.103 0.023 0.029 Out-degree centrality [Unscaled] 0.000 14.000 3.118 3.879 Eigenvector centrality 0.000 0.598 0.157 0.185 Eigenvector centrality [Unscaled] 0.000 0.423 0.111 0.131 Eigenvector centrality per component 0.000 0.336 0.088 0.104 Closeness centrality 0.007 0.029 0.018 0.010 Closeness centrality [Unscaled] 0.000 0.001 0.001 0.000 In-Closeness centrality 0.007 0.017 0.013 0.003 In-Closeness centrality [Unscaled] 0.000 0.001 0.000 0.000 Betweenness centrality 0.000 0.213 0.028 0.050 Betweenness centrality [Unscaled] 0.000 224.583 29.493 52.566 Hub centrality 0.000 0.674 0.136 0.201 Authority centrality 0.000 0.711 0.134 0.202 Information centrality 0.000 0.079 0.029 0.028 Information centrality [Unscaled] 0.000 3.202 1.198 1.120 Clique membership count 0.000 9.000 1.559 2.145 Simmelian ties 0.000 0.182 0.029 0.058 Simmelian ties [Unscaled] 0.000 6.000 0.941 1.909 Clustering coefficient 0.000 1.000 0.200 0.238
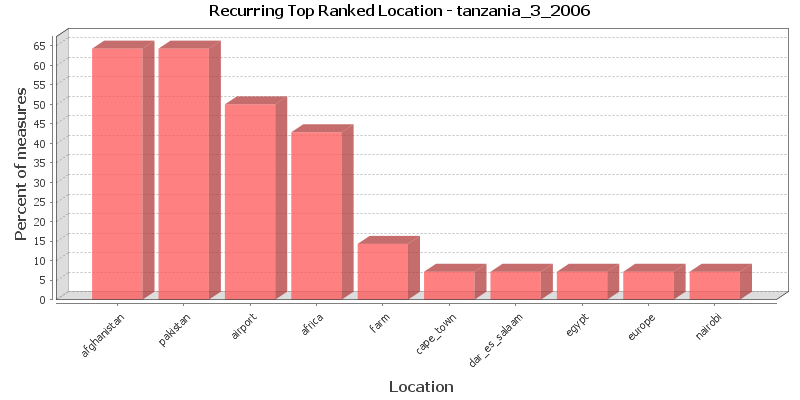
Key Nodes
This chart shows the Location that is repeatedly top-ranked in the measures listed below. The value shown is the percentage of measures for which the Location was ranked in the top three.
Total degree centrality
The Total Degree Centrality of a node is the normalized sum of its row and column degrees. Individuals or organizations who are "in the know" are those who are linked to many others and so, by virtue of their position have access to the ideas, thoughts, beliefs of many others. Individuals who are "in the know" are identified by degree centrality in the relevant social network. Those who are ranked high on this metrics have more connections to others in the same network. The scientific name of this measure is total degree centrality and it is calculated on the agent by agent matrices.
Input network: Location x Location (size: 34, density: 0.0717993)
Rank Location Value Unscaled Context* 1 pakistan 0.086 23.000 0.317 2 afghanistan 0.082 22.000 0.232 3 airport 0.067 18.000 -0.105 4 somalia 0.067 18.000 -0.105 5 africa 0.060 16.000 -0.273 6 egypt 0.045 12.000 -0.610 7 usa 0.045 12.000 -0.610 8 lebanon 0.041 11.000 -0.695 9 europe 0.037 10.000 -0.779 10 farm 0.037 10.000 -0.779 * Number of standard deviations from the mean of a random network of the same size and density
Mean: 0.023 Mean in random network: 0.072 Std.dev: 0.025 Std.dev in random network: 0.044 In-degree centrality
The In Degree Centrality of a node is its normalized in-degree. For any node, e.g. an individual or a resource, the in-links are the connections that the node of interest receives from other nodes. For example, imagine an agent by knowledge matrix then the number of in-links a piece of knowledge has is the number of agents that are connected to. The scientific name of this measure is in-degree and it is calculated on the agent by agent matrices.
Input network(s): Location x Location
Rank Location Value Unscaled 1 airport 0.125 17.000 2 afghanistan 0.081 11.000 3 pakistan 0.081 11.000 4 somalia 0.074 10.000 5 usa 0.074 10.000 6 egypt 0.037 5.000 7 israel 0.037 5.000 8 lebanon 0.037 5.000 9 farm 0.029 4.000 10 saudi_arabia 0.029 4.000 Out-degree centrality
For any node, e.g. an individual or a resource, the out-links are the connections that the node of interest sends to other nodes. For example, imagine an agent by knowledge matrix then the number of out-links an agent would have is the number of pieces of knowledge it is connected to. The scientific name of this measure is out-degree and it is calculated on the agent by agent matrices. Individuals or organizations who are high in most knowledge have more expertise or are associated with more types of knowledge than are others. If no sub-network connecting agents to knowledge exists, then this measure will not be calculated. The scientific name of this measure is out degree centrality and it is calculated on agent by knowledge matrices. Individuals or organizations who are high in "most resources" have more resources or are associated with more types of resources than are others. If no sub-network connecting agents to resources exists, then this measure will not be calculated. The scientific name of this measure is out degree centrality and it is calculated on agent by resource matrices.
Input network(s): Location x Location
Rank Location Value Unscaled 1 africa 0.103 14.000 2 pakistan 0.088 12.000 3 afghanistan 0.081 11.000 4 europe 0.059 8.000 5 somalia 0.059 8.000 6 egypt 0.051 7.000 7 farm 0.044 6.000 8 lebanon 0.044 6.000 9 usa 0.044 6.000 10 indonesia 0.037 5.000 Eigenvector centrality
Calculates the principal eigenvector of the network. A node is central to the extent that its neighbors are central. Leaders of strong cliques are individuals who or organizations who are collected to others that are themselves highly connected to each other. In other words, if you have a clique then the individual most connected to others in the clique and other cliques, is the leader of the clique. Individuals or organizations who are connected to many otherwise isolated individuals or organizations will have a much lower score in this measure then those that are connected to groups that have many connections themselves. The scientific name of this measure is eigenvector centrality and it is calculated on agent by agent matrices.
Input network: Location x Location (size: 34, density: 0.0717993)
Rank Location Value Unscaled Context* 1 pakistan 0.598 0.423 0.875 2 afghanistan 0.591 0.418 0.850 3 airport 0.562 0.398 0.749 4 africa 0.476 0.336 0.444 5 somalia 0.433 0.306 0.294 6 egypt 0.336 0.238 -0.047 7 indonesia 0.300 0.212 -0.175 8 israel 0.282 0.199 -0.238 9 lebanon 0.262 0.185 -0.307 10 saudi_arabia 0.247 0.174 -0.362 * Number of standard deviations from the mean of a random network of the same size and density
Mean: 0.157 Mean in random network: 0.349 Std.dev: 0.185 Std.dev in random network: 0.284 Eigenvector centrality per component
Calculates the principal eigenvector of the network. A node is central to the extent that its neighbors are central. Each component is extracted as a separate network, Eigenvector Centrality is computed on it and scaled according to the component size. The scores are then combined into a single result vector.
Input network(s): Location x Location
Rank Location Value 1 pakistan 0.336 2 afghanistan 0.332 3 airport 0.316 4 africa 0.267 5 somalia 0.243 6 egypt 0.189 7 indonesia 0.168 8 israel 0.158 9 lebanon 0.147 10 saudi_arabia 0.138 Closeness centrality
The average closeness of a node to the other nodes in a network (also called out-closeness). Loosely, Closeness is the inverse of the average distance in the network from the node to all other nodes.
Input network: Location x Location (size: 34, density: 0.0717993)
Rank Location Value Unscaled Context* 1 africa 0.029 0.001 -4.764 2 europe 0.029 0.001 -4.767 3 farm 0.029 0.001 -4.771 4 somalia 0.029 0.001 -4.771 5 lebanon 0.029 0.001 -4.772 6 egypt 0.028 0.001 -4.775 7 saudi_arabia 0.028 0.001 -4.777 8 pakistan 0.028 0.001 -4.781 9 afghanistan 0.028 0.001 -4.781 10 israel 0.028 0.001 -4.781 * Number of standard deviations from the mean of a random network of the same size and density
Mean: 0.018 Mean in random network: 0.230 Std.dev: 0.010 Std.dev in random network: 0.042 In-Closeness centrality
The average closeness of a node from the other nodes in a network. Loosely, Closeness is the inverse of the average distance in the network to the node and from all other nodes.
Input network(s): Location x Location
Rank Location Value Unscaled 1 cape_town 0.017 0.001 2 dar_es_salaam 0.017 0.001 3 nairobi 0.017 0.001 4 residence 0.016 0.000 5 darfur 0.016 0.000 6 kenya 0.016 0.000 7 south_africa 0.016 0.000 8 tanzania 0.016 0.000 9 manhattan 0.015 0.000 10 airport 0.015 0.000 Betweenness centrality
The Betweenness Centrality of node v in a network is defined as: across all node pairs that have a shortest path containing v, the percentage that pass through v. Individuals or organizations that are potentially influential are positioned to broker connections between groups and to bring to bear the influence of one group on another or serve as a gatekeeper between groups. This agent occurs on many of the shortest paths between other agents. The scientific name of this measure is betweenness centrality and it is calculated on agent by agent matrices.
Input network: Location x Location (size: 34, density: 0.0717993)
Rank Location Value Unscaled Context* 1 farm 0.213 224.583 0.814 2 airport 0.146 154.500 0.449 3 africa 0.123 130.267 0.322 4 europe 0.109 115.033 0.243 5 lebanon 0.075 78.867 0.054 6 new_york 0.060 63.000 -0.029 7 somalia 0.058 61.517 -0.037 8 usa 0.052 55.000 -0.071 9 egypt 0.024 24.983 -0.227 10 kenya 0.017 18.000 -0.264 * Number of standard deviations from the mean of a random network of the same size and density
Mean: 0.028 Mean in random network: 0.065 Std.dev: 0.050 Std.dev in random network: 0.181 Hub centrality
A node is hub-central to the extent that its out-links are to nodes that have many in-links. Individuals or organizations that act as hubs are sending information to a wide range of others each of whom has many others reporting to them. Technically, an agent is hub-central if its out-links are to agents that have many other agents sending links to them. The scientific name of this measure is hub centrality and it is calculated on agent by agent matrices.
Input network(s): Location x Location
Rank Location Value 1 pakistan 0.674 2 afghanistan 0.657 3 africa 0.575 4 somalia 0.399 5 egypt 0.365 6 lebanon 0.343 7 saudi_arabia 0.331 8 indonesia 0.319 9 israel 0.268 10 europe 0.238 Authority centrality
A node is authority-central to the extent that its in-links are from nodes that have many out-links. Individuals or organizations that act as authorities are receiving information from a wide range of others each of whom sends information to a large number of others. Technically, an agent is authority-central if its in-links are from agents that have are sending links to many others. The scientific name of this measure is authority centrality and it is calculated on agent by agent matrices.
Input network(s): Location x Location
Rank Location Value 1 airport 0.711 2 afghanistan 0.625 3 pakistan 0.619 4 somalia 0.582 5 egypt 0.305 6 israel 0.297 7 lebanon 0.252 8 saudi_arabia 0.246 9 residence 0.123 10 indonesia 0.119 Information centrality
Calculate the Stephenson and Zelen information centrality measure for each node.
Input network(s): Location x Location
Rank Location Value Unscaled 1 africa 0.079 3.202 2 pakistan 0.071 2.879 3 afghanistan 0.069 2.796 4 europe 0.068 2.752 5 egypt 0.062 2.529 6 usa 0.061 2.504 7 somalia 0.061 2.493 8 farm 0.060 2.458 9 lebanon 0.057 2.335 10 indonesia 0.056 2.275 Clique membership count
The number of distinct cliques to which each node belongs. Individuals or organizations who are high in number of cliques are those that belong to a large number of distinct cliques. A clique is defined as a group of three or more actors that have many connections to each other and relatively fewer connections to those in other groups. The scientific name of this measure is clique count and it is calculated on the agent by agent matrices.
Input network(s): Location x Location
Rank Location Value 1 airport 9.000 2 africa 5.000 3 egypt 5.000 4 pakistan 5.000 5 afghanistan 4.000 6 europe 4.000 7 farm 3.000 8 indonesia 3.000 9 lebanon 3.000 10 somalia 3.000 Simmelian ties
The normalized number of Simmelian ties of each node.
Input network(s): Location x Location
Rank Location Value Unscaled 1 afghanistan 0.182 6.000 2 pakistan 0.182 6.000 3 somalia 0.152 5.000 4 egypt 0.121 4.000 5 lebanon 0.121 4.000 6 saudi_arabia 0.121 4.000 7 israel 0.091 3.000 Clustering coefficient
Measures the degree of clustering in a network by averaging the clustering coefficient of each node, which is defined as the density of the node's ego network.
Input network(s): Location x Location
Rank Location Value 1 north_america 1.000 2 saudi_arabia 0.600 3 residence 0.500 4 afghanistan 0.484 5 israel 0.444 6 lebanon 0.444 7 somalia 0.429 8 pakistan 0.395 9 london 0.375 10 egypt 0.359
Key Nodes Table
This shows the top scoring nodes side-by-side for selected measures.
Rank Betweenness centrality Closeness centrality Eigenvector centrality Eigenvector centrality per component In-degree centrality In-Closeness centrality Out-degree centrality Total degree centrality 1 farm africa pakistan pakistan airport cape_town africa pakistan 2 airport europe afghanistan afghanistan afghanistan dar_es_salaam pakistan afghanistan 3 africa farm airport airport pakistan nairobi afghanistan airport 4 europe somalia africa africa somalia residence europe somalia 5 lebanon lebanon somalia somalia usa darfur somalia africa 6 new_york egypt egypt egypt egypt kenya egypt egypt 7 somalia saudi_arabia indonesia indonesia israel south_africa farm usa 8 usa pakistan israel israel lebanon tanzania lebanon lebanon 9 egypt afghanistan lebanon lebanon farm manhattan usa europe 10 kenya israel saudi_arabia saudi_arabia saudi_arabia airport indonesia farm