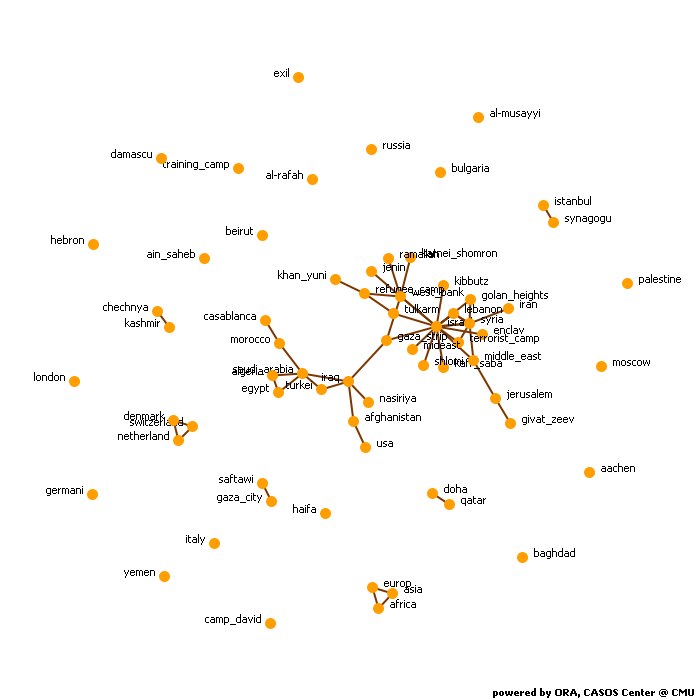
Network Level Measures
Measure Value Row count 66.000 Column count 66.000 Link count 55.000 Density 0.013 Components of 1 node (isolates) 20 Components of 2 nodes (dyadic isolates) 4 Components of 3 or more nodes 3 Reciprocity 0.082 Characteristic path length 3.435 Clustering coefficient 0.192 Network levels (diameter) 10.000 Network fragmentation 0.764 Krackhardt connectedness 0.236 Krackhardt efficiency 0.974 Krackhardt hierarchy 0.935 Krackhardt upperboundedness 0.527 Degree centralization 0.031 Betweenness centralization 0.034 Closeness centralization 0.002 Eigenvector centralization 0.768 Reciprocal (symmetric)? No (8% of the links are reciprocal)
Node Level Measures
Measure Min Max Avg Stddev Total degree centrality 0.000 0.034 0.003 0.005 Total degree centrality [Unscaled] 0.000 22.000 2.045 3.574 In-degree centrality 0.000 0.052 0.003 0.007 In-degree centrality [Unscaled] 0.000 17.000 1.045 2.434 Out-degree centrality 0.000 0.030 0.003 0.006 Out-degree centrality [Unscaled] 0.000 10.000 1.045 1.829 Eigenvector centrality 0.000 0.818 0.074 0.158 Eigenvector centrality [Unscaled] 0.000 0.579 0.052 0.112 Eigenvector centrality per component 0.000 0.280 0.030 0.053 Closeness centrality 0.003 0.004 0.003 0.000 Closeness centrality [Unscaled] 0.000 0.000 0.000 0.000 In-Closeness centrality 0.003 0.005 0.003 0.001 In-Closeness centrality [Unscaled] 0.000 0.000 0.000 0.000 Betweenness centrality 0.000 0.035 0.001 0.005 Betweenness centrality [Unscaled] 0.000 147.000 6.015 21.774 Hub centrality 0.000 0.889 0.067 0.161 Authority centrality 0.000 0.963 0.054 0.166 Information centrality 0.000 0.064 0.015 0.017 Information centrality [Unscaled] 0.000 2.170 0.514 0.582 Clique membership count 0.000 5.000 0.409 0.870 Simmelian ties 0.000 0.031 0.001 0.006 Simmelian ties [Unscaled] 0.000 2.000 0.091 0.417 Clustering coefficient 0.000 1.000 0.192 0.338
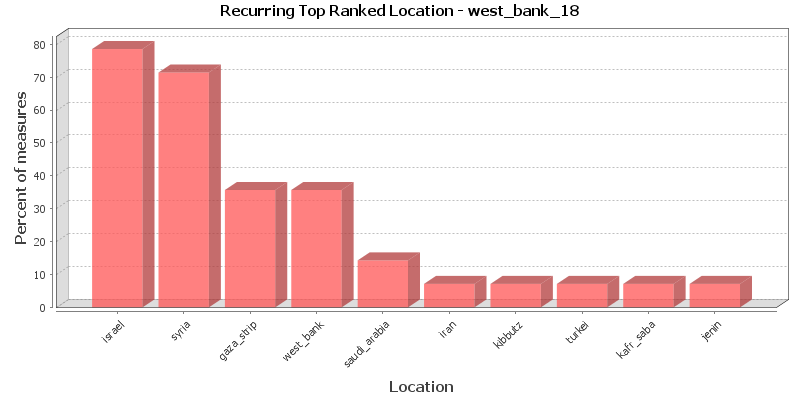
Key Nodes
This chart shows the Location that is repeatedly top-ranked in the measures listed below. The value shown is the percentage of measures for which the Location was ranked in the top three.
Total degree centrality
The Total Degree Centrality of a node is the normalized sum of its row and column degrees. Individuals or organizations who are "in the know" are those who are linked to many others and so, by virtue of their position have access to the ideas, thoughts, beliefs of many others. Individuals who are "in the know" are identified by degree centrality in the relevant social network. Those who are ranked high on this metrics have more connections to others in the same network. The scientific name of this measure is total degree centrality and it is calculated on the agent by agent matrices.
Input network: location---location (size: 66, density: 0.0126263)
Rank Location Value Unscaled Context* 1 israel 0.034 22.000 1.525 2 syria 0.023 15.000 0.748 3 west_bank 0.018 12.000 0.414 4 gaza_strip 0.012 8.000 -0.030 5 lebanon 0.009 6.000 -0.252 6 iraq 0.008 5.000 -0.363 7 saudi_arabia 0.008 5.000 -0.363 8 golan_heights 0.005 3.000 -0.585 9 tulkarm 0.005 3.000 -0.585 10 refugee_camp 0.005 3.000 -0.585 * Number of standard deviations from the mean of a random network of the same size and density
Mean: 0.003 Mean in random network: 0.013 Std.dev: 0.005 Std.dev in random network: 0.014 In-degree centrality
The In Degree Centrality of a node is its normalized in-degree. For any node, e.g. an individual or a resource, the in-links are the connections that the node of interest receives from other nodes. For example, imagine an agent by knowledge matrix then the number of in-links a piece of knowledge has is the number of agents that are connected to. The scientific name of this measure is in-degree and it is calculated on the agent by agent matrices.
Input network(s): location---location
Rank Location Value Unscaled 1 israel 0.052 17.000 2 syria 0.024 8.000 3 gaza_strip 0.018 6.000 4 lebanon 0.012 4.000 5 iraq 0.009 3.000 6 iran 0.006 2.000 7 switzerland 0.006 2.000 8 africa 0.006 2.000 9 refugee_camp 0.006 2.000 10 west_bank 0.006 2.000 Out-degree centrality
For any node, e.g. an individual or a resource, the out-links are the connections that the node of interest sends to other nodes. For example, imagine an agent by knowledge matrix then the number of out-links an agent would have is the number of pieces of knowledge it is connected to. The scientific name of this measure is out-degree and it is calculated on the agent by agent matrices. Individuals or organizations who are high in most knowledge have more expertise or are associated with more types of knowledge than are others. If no sub-network connecting agents to knowledge exists, then this measure will not be calculated. The scientific name of this measure is out degree centrality and it is calculated on agent by knowledge matrices. Individuals or organizations who are high in "most resources" have more resources or are associated with more types of resources than are others. If no sub-network connecting agents to resources exists, then this measure will not be calculated. The scientific name of this measure is out degree centrality and it is calculated on agent by resource matrices.
Input network(s): location---location
Rank Location Value Unscaled 1 west_bank 0.030 10.000 2 syria 0.024 8.000 3 israel 0.021 7.000 4 saudi_arabia 0.012 4.000 5 tulkarm 0.009 3.000 6 gaza_strip 0.006 2.000 7 iraq 0.006 2.000 8 turkei 0.006 2.000 9 terrorist_camp 0.006 2.000 10 netherland 0.006 2.000 Eigenvector centrality
Calculates the principal eigenvector of the network. A node is central to the extent that its neighbors are central. Leaders of strong cliques are individuals who or organizations who are collected to others that are themselves highly connected to each other. In other words, if you have a clique then the individual most connected to others in the clique and other cliques, is the leader of the clique. Individuals or organizations who are connected to many otherwise isolated individuals or organizations will have a much lower score in this measure then those that are connected to groups that have many connections themselves. The scientific name of this measure is eigenvector centrality and it is calculated on agent by agent matrices.
Input network: location---location (size: 66, density: 0.0126263)
Rank Location Value Unscaled Context* 1 israel 0.818 0.579 1.588 2 gaza_strip 0.572 0.404 0.650 3 syria 0.555 0.392 0.586 4 west_bank 0.542 0.383 0.538 5 lebanon 0.321 0.227 -0.304 6 golan_heights 0.249 0.176 -0.577 7 tulkarm 0.224 0.159 -0.670 8 middle_east 0.180 0.128 -0.837 9 terrorist_camp 0.177 0.125 -0.849 10 iran 0.143 0.101 -0.978 * Number of standard deviations from the mean of a random network of the same size and density
Mean: 0.074 Mean in random network: 0.401 Std.dev: 0.158 Std.dev in random network: 0.263 Eigenvector centrality per component
Calculates the principal eigenvector of the network. A node is central to the extent that its neighbors are central. Each component is extracted as a separate network, Eigenvector Centrality is computed on it and scaled according to the component size. The scores are then combined into a single result vector.
Input network(s): location---location
Rank Location Value 1 israel 0.280 2 gaza_strip 0.196 3 syria 0.190 4 west_bank 0.186 5 lebanon 0.110 6 golan_heights 0.085 7 tulkarm 0.077 8 middle_east 0.062 9 terrorist_camp 0.061 10 iran 0.049 Closeness centrality
The average closeness of a node to the other nodes in a network (also called out-closeness). Loosely, Closeness is the inverse of the average distance in the network from the node to all other nodes.
Input network: location---location (size: 66, density: 0.0126263)
Rank Location Value Unscaled Context* 1 turkei 0.004 0.000 -4.533 2 saudi_arabia 0.004 0.000 -4.528 3 givat_zeev 0.004 0.000 -4.516 4 nasiriya 0.004 0.000 -4.516 5 tulkarm 0.004 0.000 -4.512 6 jerusalem 0.004 0.000 -4.512 7 khan_yuni 0.004 0.000 -4.512 8 iraq 0.004 0.000 -4.512 9 terrorist_camp 0.004 0.000 -4.508 10 middle_east 0.004 0.000 -4.508 * Number of standard deviations from the mean of a random network of the same size and density
Mean: 0.003 Mean in random network: -0.075 Std.dev: 0.000 Std.dev in random network: -0.017 In-Closeness centrality
The average closeness of a node from the other nodes in a network. Loosely, Closeness is the inverse of the average distance in the network to the node and from all other nodes.
Input network(s): location---location
Rank Location Value Unscaled 1 jenin 0.005 0.000 2 karnei_shomron 0.005 0.000 3 ramallah 0.005 0.000 4 iran 0.005 0.000 5 israel 0.004 0.000 6 west_bank 0.004 0.000 7 golan_heights 0.004 0.000 8 lebanon 0.004 0.000 9 syria 0.004 0.000 10 gaza_strip 0.004 0.000 Betweenness centrality
The Betweenness Centrality of node v in a network is defined as: across all node pairs that have a shortest path containing v, the percentage that pass through v. Individuals or organizations that are potentially influential are positioned to broker connections between groups and to bring to bear the influence of one group on another or serve as a gatekeeper between groups. This agent occurs on many of the shortest paths between other agents. The scientific name of this measure is betweenness centrality and it is calculated on agent by agent matrices.
Input network: location---location (size: 66, density: 0.0126263)
Rank Location Value Unscaled Context* 1 israel 0.035 147.000 -0.251 2 west_bank 0.021 89.000 -0.423 3 gaza_strip 0.009 36.000 -0.581 4 iraq 0.008 33.000 -0.590 5 syria 0.007 28.000 -0.605 6 middle_east 0.005 20.000 -0.628 7 lebanon 0.004 15.000 -0.643 8 refugee_camp 0.004 15.000 -0.643 9 jerusalem 0.003 11.000 -0.655 10 saudi_arabia 0.001 3.000 -0.679 * Number of standard deviations from the mean of a random network of the same size and density
Mean: 0.001 Mean in random network: 0.056 Std.dev: 0.005 Std.dev in random network: 0.081 Hub centrality
A node is hub-central to the extent that its out-links are to nodes that have many in-links. Individuals or organizations that act as hubs are sending information to a wide range of others each of whom has many others reporting to them. Technically, an agent is hub-central if its out-links are to agents that have many other agents sending links to them. The scientific name of this measure is hub centrality and it is calculated on agent by agent matrices.
Input network(s): location---location
Rank Location Value 1 west_bank 0.889 2 syria 0.640 3 israel 0.543 4 tulkarm 0.319 5 gaza_strip 0.311 6 terrorist_camp 0.225 7 lebanon 0.225 8 middle_east 0.225 9 kibbutz 0.155 10 kafr_saba 0.155 Authority centrality
A node is authority-central to the extent that its in-links are from nodes that have many out-links. Individuals or organizations that act as authorities are receiving information from a wide range of others each of whom sends information to a large number of others. Technically, an agent is authority-central if its in-links are from agents that have are sending links to many others. The scientific name of this measure is authority centrality and it is calculated on agent by agent matrices.
Input network(s): location---location
Rank Location Value 1 israel 0.963 2 gaza_strip 0.737 3 syria 0.433 4 lebanon 0.397 5 ramallah 0.287 6 iran 0.206 7 jenin 0.143 8 karnei_shomron 0.143 9 west_bank 0.090 10 golan_heights 0.088 Information centrality
Calculate the Stephenson and Zelen information centrality measure for each node.
Input network(s): location---location
Rank Location Value Unscaled 1 west_bank 0.064 2.170 2 israel 0.055 1.874 3 syria 0.055 1.871 4 saudi_arabia 0.049 1.658 5 tulkarm 0.043 1.467 6 middle_east 0.036 1.225 7 iraq 0.036 1.214 8 gaza_strip 0.035 1.200 9 turkei 0.035 1.185 10 terrorist_camp 0.035 1.183 Clique membership count
The number of distinct cliques to which each node belongs. Individuals or organizations who are high in number of cliques are those that belong to a large number of distinct cliques. A clique is defined as a group of three or more actors that have many connections to each other and relatively fewer connections to those in other groups. The scientific name of this measure is clique count and it is calculated on the agent by agent matrices.
Input network(s): location---location
Rank Location Value 1 israel 5.000 2 syria 4.000 3 saudi_arabia 2.000 4 gaza_strip 1.000 5 iraq 1.000 6 switzerland 1.000 7 turkei 1.000 8 asia 1.000 9 terrorist_camp 1.000 10 netherland 1.000 Simmelian ties
The normalized number of Simmelian ties of each node.
Input network(s): location---location
Rank Location Value Unscaled 1 israel 0.031 2.000 2 lebanon 0.031 2.000 3 syria 0.031 2.000 Clustering coefficient
Measures the degree of clustering in a network by averaging the clustering coefficient of each node, which is defined as the density of the node's ego network.
Input network(s): location---location
Rank Location Value 1 iran 1.000 2 kibbutz 1.000 3 kafr_saba 1.000 4 enclav 1.000 5 terrorist_camp 1.000 6 lebanon 1.000 7 golan_heights 1.000 8 mideast 1.000 9 shlomi 1.000 10 middle_east 0.444
Key Nodes Table
This shows the top scoring nodes side-by-side for selected measures.
Rank Betweenness centrality Closeness centrality Eigenvector centrality Eigenvector centrality per component In-degree centrality In-Closeness centrality Out-degree centrality Total degree centrality 1 israel turkei israel israel israel jenin west_bank israel 2 west_bank saudi_arabia gaza_strip gaza_strip syria karnei_shomron syria syria 3 gaza_strip givat_zeev syria syria gaza_strip ramallah israel west_bank 4 iraq nasiriya west_bank west_bank lebanon iran saudi_arabia gaza_strip 5 syria tulkarm lebanon lebanon iraq israel tulkarm lebanon 6 middle_east jerusalem golan_heights golan_heights iran west_bank gaza_strip iraq 7 lebanon khan_yuni tulkarm tulkarm switzerland golan_heights iraq saudi_arabia 8 refugee_camp iraq middle_east middle_east africa lebanon turkei golan_heights 9 jerusalem terrorist_camp terrorist_camp terrorist_camp refugee_camp syria terrorist_camp tulkarm 10 saudi_arabia middle_east iran iran west_bank gaza_strip netherland refugee_camp