
Geospatially Enabled Network Science
Overview | People | Collaborators | Sponsors | Publications | Tools
In exploring the various influences and roles in human relationships we will now consider one of the most important features for understanding large-scale social interactions: space. Clearly, space is important, and as such, we intend to equip network analysts with appropriate tools for analyzing networks where locational information is available. In addition to enhancing traditional network analysis with spatial information, we are exploring the use of probabilistic graphical models for analyzing spatially embedded networks.
Combining Spatial Analysis and Network Analysis
The Dynamic Network Analysis used in ORA allows for the simultaneous consideration of multiple types of relationships and node classes. We consider ways of integrating location information in this context, using both attributes and relations to represent positional information. In doing so, we have identified several new challenges regarding resolution/aggregation and the ecological fallacy as it applies to spatially embedded network analysis. The ecological fallacy is based on the observation that any calculation on aggregated data carries the risk that subsequent results may be an artifact of the aggregation. This happens because once data are aggregated, any subsequent analysis assumes that the data within the aggregate unit are homogeneous(Robinson1950;Openshaw1981;Openshaw1999) and any individual differences are unimportant. Consider the example dataset show in Table 1 and the aggregations shown in Tables 2 and 3. Although both aggregations obscure the information in the original data, the moderate aggregation better approximates the original data than the extreme aggregation.
| 2 | 5 | 6 | 2 |
| 3 | 5 | 5 | 1 |
| 4 | 5 | 2 | 3 |
| 7 | 4 | 1 | 2 |
Table 1: Original Data
| 2.5 | 5 | 5.5 | 1.5 |
| 5.5 | 4.5 | 1.5 | 2.5 |
Table 2: Moderate Aggregation
| 4.0 | 4.75 | 3.5 | 2.0 |
Table 3: Extreme Aggregation
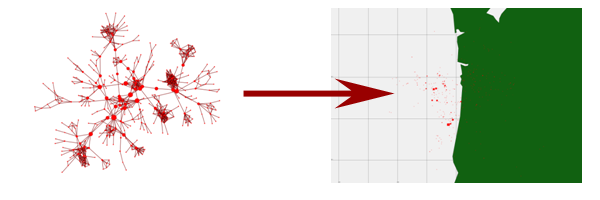
We have developed several techniques in the Ora-GI visualization tool for avoiding these problems by facilitating the examination of spatially embedded networks at multiple levels of resolution.
We have also adapted several traditional network analytic measures for the spatial domain, particularly betweenness centrality and closeness centrality. In addition to formulating these measure, we have also proposed efficient algorithms for computing these measures on large networks.
Probabilistic Graphical Models
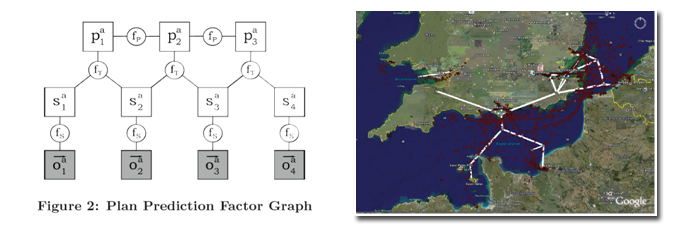
Often we are able to retrieve several types of data on a geospatial system -- for example, we can correlate spatial / temporal information such as AIS data with relational information such as that found in Lloyd's register. Ideally, we would be able to detect patterns that allow us to use geospatial data to infer relationships, and relationships to predict geospatial behavior. However, most current literature approaching this task does not truly integrate the two types of data, instead using one dataset as merely a preprocessor for the other (e.g. clustering only those ships sharing a common owner). Methods like this are limited in their ability to discover complex patterns.
A promising alternative comes in the form of probabilistic graphical models (PGMs), which can encode dependencies between many kinds of variables in the data. PGMs are a very general representation capable of encoding both relational and spatial data, making them an excellent choice for finding patterns spanning datasets. Working out the structure of graphical models that allow us to efficiently find interesting patterns in large geospatial datasets is an important theoretical advance.